What a difference a day makes! December ISM Services data suggests the service sector remains strong. The JOLTS report showed there were 8.09 million job openings in November — that’s well above the 7.7 million that was expected. US economic growth is strong, as is the labor market. Stocks sold off on the news and for the rest of the trading day. Tuesday’s economic data brought back thoughts of the possibility of the Fed dialing back on its rate cuts in 2025.
The Federal Open Market Committee (FOMC) releases its minutes on Wednesday at 2:00 PM. Investors will be listening for any hawkish signals from the Fed. Expect some market action on Wednesday afternoon. The stock market is closed on Thursday in honor of former President Jimmy Carter. On Friday, we have the December Non-Farm Payrolls, so don’t be surprised if volatility climbs higher this week.
The Return of the Inflation Narrative
While stocks sold off on inflation and labor concerns, the bond market saw a lot of excitement. Treasury yields rose on the news with the 10-year yields closing at 4.68%. It’s within spitting distance of its 52-week high of 4.737. If it gets there, things could get worse for stocks.
They were bad enough on Tuesday. All broader indexes closed lower with the Nasdaq Composite ($COMPQ) closing 1.89% lower. The daily chart of the Nasdaq (see below) doesn’t paint a pretty picture.
FIGURE 1. DAILY CHART OF NASDAQ COMPOSITE. The series of lower highs should be an alert that the index is pulling back.Chart source: StockCharts.com. For educational purposes.
The Nasdaq Composite is getting close to its 50-day simple moving average (SMA), and a break below it would be cause for concern. It would be even more concerning if the break coincides with a declining Nasdaq Advance-Decline Issues (lower panel).
The Nasdaq has crossed below its 50-day SMA in the past and recovered. The recoveries presented opportunities to accumulate long positions in Nasdaq stocks. A similar scenario could play out this time, but Mark Twain’s quote, “History doesn’t repeat itself, but it often rhymes” keeps popping up. What will the rhyme be this time?
Energy and Health Care
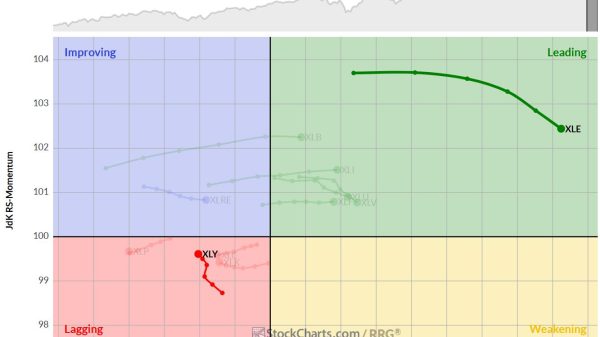
Overall, it was a pretty grim day for stocks. Nine of the 11 S&P sectors closed lower; Energy and Health Care were the only two that closed higher. However, the charts of the exchange-traded funds (ETFs) that represent these sectors — Energy Select Sector SPDR (XLE) and Health Care Select Sector SPDR (XLV) — don’t display a bullish trend. The Bullish Percent Index (BPI) for these sectors is below 50, with the S&P Healthcare Sector BPI being the more favorable of the two at 39.39 (see chart below).
FIGURE 2. ENERGY AND HEALTH CARE SECTORS. Even though Energy and Health Care were the best performing sectors on Tuesday, their charts aren’t exhibiting bullish characteristics.Chart source: StockChartsACP. For educational purposes.
The best-performing S&P 500 stock on Tuesday was Moderna, Inc. (MRNA) with an 11.65% rise. Moderna is developing a vaccine for bird flu, which helped propel the stock price. The Market Movers panel on Your Dashboard shows a handful of health care and energy stocks in the S&P 500, %Up category.
Even though the Energy or Health Care sector charts are far from bullish, it’s worth keeping an eye on them. If a bullish trend takes shape while other sectors, such as Technology and Consumer Discretionary, turn bearish, it may be worth allocating a portion of your portfolio to the bullish-performing sectors.
Disclaimer: This blog is for educational purposes only and should not be construed as financial advice. The ideas and strategies should never be used without first assessing your own personal and financial situation, or without consulting a financial professional.


