Connect with us

Hi, what are you looking for?

Stock

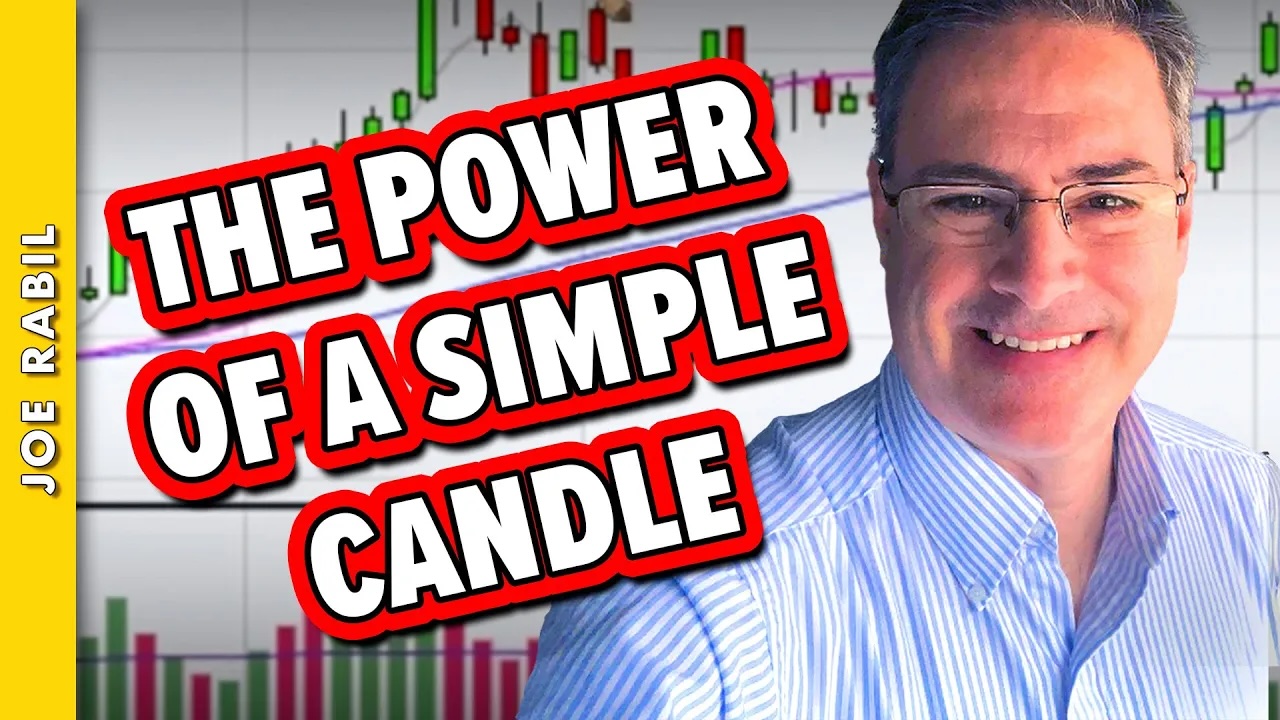
A Simple Candle With BIG Meaning

In this exclusive StockCharts video, Joe shows a specific candlestick pattern that, when it develops at the right time, can signal the start of a new upleg. He uses NVDA, MSFT and GLD to explain how this can setup at different times and can give a timely signal to look to enter or in some cases a signal to exit. Joe then covers TNX and some commodities like Silver, Oil and Copper. Finally, he goes through the symbol requests that came through this week, including GOOGL, GBTC, and more.

This video was originally published on October 30, 2024. Click this link to watch on StockCharts TV.

Archived videos from Joe are available at this link. Send symbol requests to stocktalk@stockcharts.com; you can also submit a request in the comments section below the video on YouTube. Symbol Requests can be sent in throughout the week prior to the next show.

Enter Your Information Below To Receive Free Trading Ideas, Latest News And Articles.

    Your information is secure and your privacy is protected. By opting in you agree to receive emails from us. Remember that you can opt-out any time, we hate spam too!

    You May Also Like

    Stock

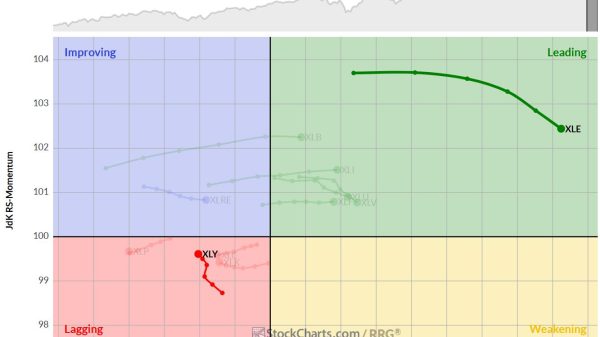
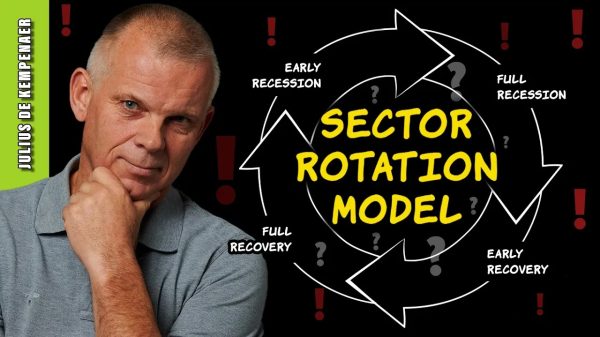
    In this video from StockCharts TV, Julius examines the theoretical sector rotation model and aligns it with current state of sector rotation on Relative...

    Stock

    In this edition of StockCharts TV‘s The Final Bar, Dave uncovers strength in SQSP using the Stochastics Oscillator and the StochRSI indicator. He shares...

    Latest News

    Independent presidential candidate Robert F. Kennedy, Jr. has revealed what he says is his path to the White House as he faces increased pressure...

    Latest News

    Conservatives on social media took a victory lap on Tuesday in response to the news that Meta had ended its controversial fact-checking practices and...