


When the stock market is hobbling along, trying to determine whether the recent jobs and manufacturing data are good or bad for the economy, it’s easy to miss some of the stocks that could make intermediate-term profitable returns.
One stock that has shown strong technical strength in the last couple of days is Tesla, Inc. (TSLA). I noticed TSLA stock entered the StockCharts Technical Rank (SCTR) Reports top 5 in the Large Cap, Top Up category. When an actively-traded stock like TSLA pulls back almost 30% and shows signs of recovery, it’s time to pay attention.
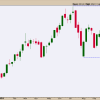
FIGURE 1. DAILY SCTR REPORTS SHOW TSLA IN THE TOP 5 OF THE TOP-UP, LARGE-CAP STOCKS.Image source: StockCharts.com. For educational purposes.
Tesla Stock Analysis
While the rise in Tesla’s stock price can be attributed to news of the company launching self-driving assistance software, it’s worth analyzing TSLA stock from a technical perspective. If there’s enough momentum behind the stock price rise, it could make for a profitable intermediate-term trade.
We’ll start with an analysis of the weekly chart of TSLA (see below).
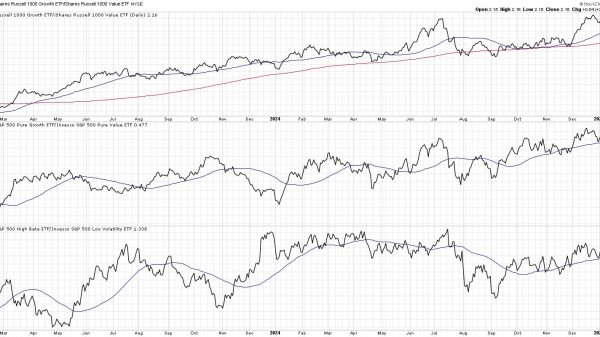
FIGURE 2. TSLA STOCK ANALYSIS ON A WEEKLY CHART. TSLA is trading between its 50- and 200-week moving average. Its RSI is rising gradually, as is its relative performance against the S&P 500.Chart source: StockChartsACP. For educational purposes.
TSLA is trading between its 50- and 200-week simple moving averages (SMA). Both SMAs indicate that the weekly trend in TSLA stock is relatively flat. However, the SCTR score is rising, and the relative strength index (RSI) is displaying a gentle upward slope. The relative strength of TSLA with respect to the S&P 500 ($SPX) has been weakening. If the line breaks above the downward-sloping red-dashed trendline (see bottom panel), from a weekly perspective, the stock could rise further. TSLA’s stock price was in the $400 area before its decline.
Is it worth buying the stock now? Let’s analyze Tesla’s daily price action (see below).
FIGURE 3. DAILY CHART ANALYSIS OF TSLA STOCK PRICE. Tesla’s stock price is still above its August 20 high, but momentum needs to be stronger. Look for MACD to start moving higher.Chart source: StockChartsACP. For educational purposes.
The following are some points to note:
TSLA is trading above its 21-day exponential moving average and 50-day SMA.The short-term uptrend from the August low is still valid.The Chaikin Money Flow (CMF) indicator is in positive territory, which suggests that there is more buying than selling pressure.The Moving Average Convergence/Divergence (MACD) oscillator displays relatively weak momentum.When Should You Buy TSLA?
Since TSLA’s stock price is news-related, it’s best to thoroughly analyze the chart before deciding when to enter a long position. The following are a few points to consider:
Can TSLA take out its August 20 high? If it does, then you have signs of an uptrend (higher highs and higher lows). If not, look to see where the stock price establishes its next low. If it goes below the upward trendline, then the uptrend condition is violated.Although the CMF shows more buying pressure, it’ll have to move higher to levels similar to the jump from July 1 to July 10.The MACD must cross into positive territory and move higher, like in July.Last, but not least, the SCTR score needs to remain above 70.When Should You Exit TSLA?
Let’s assume the upward trend continues with strong volume and momentum. If you were to open a long position above $228 (August high), then, on your chart, use the Annotations tool to add Fibonacci Retracement levels from a recent low and high. Use these levels to help determine entry and exit points.
The bottom line. Add the daily and weekly charts of TSLA to one of your StockCharts ChartLists. Watch the price action and determine if it’s worth entering a trade. Before entering the trade, know how much you’re willing to lose on the trade and set your stop loss levels and profit targets. Set StockCharts Alerts to notify you when specific price levels are hit. You never want to marry a stock. It’s a numbers game.
Disclaimer: This blog is for educational purposes only and should not be construed as financial advice. The ideas and strategies should never be used without first assessing your own personal and financial situation, or without consulting a financial professional.