


I hope you had a relaxing, restful long weekend, and welcome to September.
It was a pretty dismal post-Labor Day trading session. We all know September is the worst for stocks, but let’s hope the first day’s action doesn’t foretell how the rest of it will play out. All the broader equity indexes are down, with the Nasdaq taking the biggest hit. The Nasdaq Composite ($COMPQ) and Nasdaq 100 Index ($NDX) closed lower by over 3%.
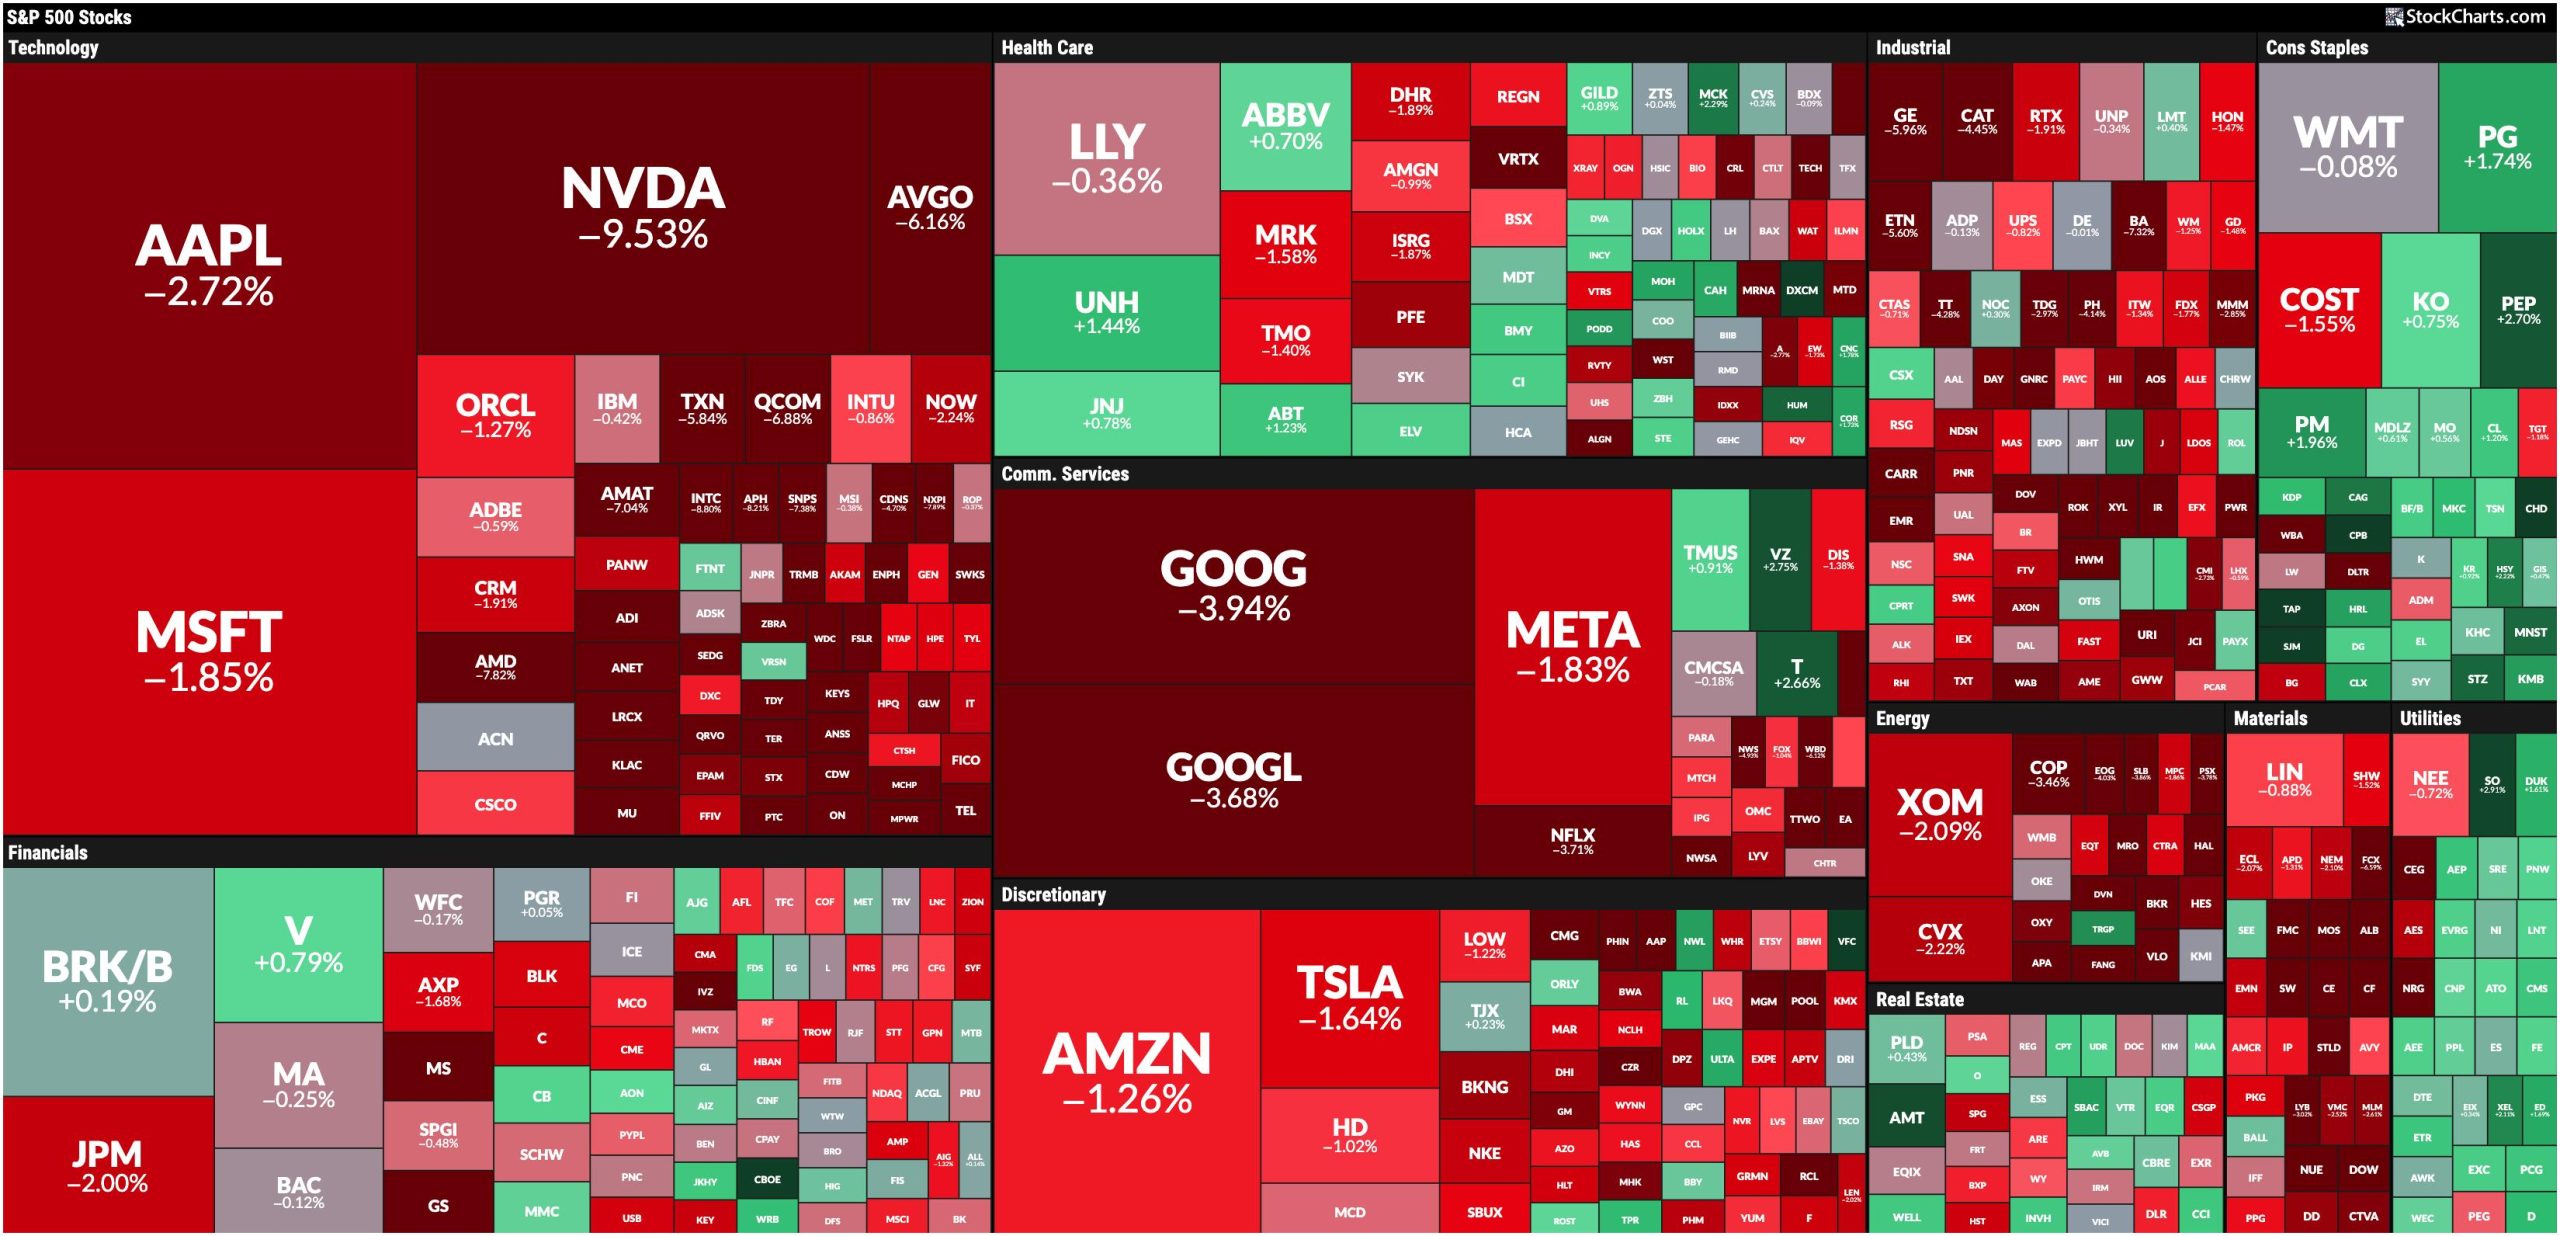
The StockCharts MarketCarpet was a sea of red, with technology stocks leading down. Some pockets of strength can be seen in Consumer Staples, Real Estate, and Utilities, the leading sectors in Tuesday’s trading.
FIGURE 1. A SEA OF RED. The StockCharts MarketCarpet gives you a good idea of stock market action.Image source: StockCharts.com. For educational purposes.
Tuesday’s Manufacturing PMI was 47.2%, which is lower than expected. This suggests that manufacturing activity is contracting, which may have been the catalyst that led to the stock market selloff.
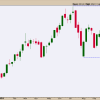
The daily chart of the S&P 500 ($SPX) below shows the index hit its 50-day simple moving average (SMA) and bounced off it. But what’s less discouraging is that it closed below its 21-day exponential moving average (EMA) and a consolidation range.
FIGURE 2. THE S&P 500 BREAKS BELOW ITS CONSOLIDATION RANGE. If momentum continues to slow, there could be more selling pressure in the near-term.Chart source: StockCharts.com. For educational purposes.
Overall, the pullback is still well above its August low, so, technically, Tuesday’s selloff isn’t as bad as it may seem. But it’s not all that great, either. The full stochastic oscillator in the lower panel shows declining momentum, so there’s a chance that the chart could get ugly.
Techs Tank
The Nasdaq Composite chart looks even worse. The index is flirting with its 100-day SMA and is below the 38.2% Fibonacci retracement level. The stochastic oscillator is also declining much steeper than for the S&P 500.
FIGURE 3. TECH STOCKS TANK. The Nasdaq Composite is flirting with the support of its 100-day moving average. The stochastic oscillator in the lower panel is in a steep decline.Chart source: StockCharts.com. For educational purposes.
The selling frenzy in Tech stocks isn’t new, especially in semiconductor stocks. Nvidia’s earnings weren’t good enough for the market, and Broadcom, Inc. (AVGO) will announce its earnings on Thursday. AVGO stock closed lower by over 6%, and NVDA closed over 9% lower. If Broadcom doesn’t report strong enough earnings, there could be more of a selloff in the Technology sector.
Of course, time will tell, but it’s worth watching the CBOE Volatility Index ($VIX), which rose 38.13%. That may seem high, but it’s not as high as the August 5 spike.
FIGURE 4. THE FEAR INDEX ($VIX) ROSE OVER 38% ON TUESDAY. A spiking VIX is something to watch since it indicates fear among investors, which means further selling could occur.Chart source: StockCharts.com. For educational purposes.
When the VIX starts spiking, it indicates nervousness is in the air. If a rising VIX keeps you up at night, it may be better to take some profits, especially in your most profitable positions. There’s a chance that investors may rotate out of mega-cap tech stocks and into other sectors such as Financials, Utilities, and Health Care.
But today’s market action isn’t showing strength anywhere. Precious metals, oil prices, and cryptocurrencies all fell. The only area that showed strength was the US dollar and bond prices, the latter due to a fall in Treasury yields.
Closing Position
There’s a chance the market could digest today’s Manufacturing PMI data and recover, but there are two factors that warrant cautious trading—a rising VIX and September’s seasonal weakness. Earnings from Broadcom, Inc. and Friday’s Non-Farm Payroll data will be critical variables.
Links to Charts in This Article
Daily chart of S&P 500.Daily chart of Nasdaq Composite.Daily chart of $VIX.Disclaimer: This blog is for educational purposes only and should not be construed as financial advice. The ideas and strategies should never be used without first assessing your own personal and financial situation, or without consulting a financial professional.