


In early 2024, MicroStrategy (MSTR) became a meme stock favorite thanks to its close ties to Bitcoin. If you rode the hype to its peak in March, hopefully you cashed out before hedge funds began shorting it heavily and going long Bitcoin instead.
How would you have known that hedge funds would begin plunging the stock? Like most traders, you probably wouldn’t have direct access to this type of information before it’s too late. But you’d have indirect information from institutional investors’ “footprints” in the market.
Tracing the Impact of Hedge Fund Shorting in MSTR
Pull up your SharpCharts platform, type MSTR in the symbol box, and look at its price action in March. It peaked at $200 a share, which is when hedge funds began shorting the stock.
In the Overlays section below the price chart, add the 200-day simple moving average (SMA). Even though MSTR’s intermediate-term trend is down, its long-term trend is still up, yet it’s currently being challenged.
Clues That Smack of Heavy Short Selling
Here’s what I’m looking at—my complete chart (which you can follow or customize yourself by clicking on this link).
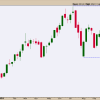
DAILY CHART OF MSTR STOCK. The footprints of hedge fund activity were evident in the divergence between price and momentum.Chart source: StockCharts.com. For educational purposes.
Look at the blue lines in the lower panels that follow the contours of the price action, Relative Strength Index (RSI), and the Chaikin Money Flow (CMF). You may not have had knowledge of hedge fund shorting activity, but the traces of their actions are evident in the divergence between price action and momentum.
The jump from $49 to $200 in just over a month screams meme momentum. But what momentum? The RSI tells you that those three consecutive higher swing points from the end of February to the March peak are overbought, with momentum dropping off. The CMF also shows that buying pressure is declining as the price keeps moving higher.
The Ichimoku Cloud is plotted to measure the intermediate-term trend and momentum. As you can see, the first bounce after the March decline (see orange circle) was met with buying at the 61.8% Fibonacci Retracement line. The second and third took place at the 200-day SMA.
Despite the volatility, the intermediate trend is sideways, and the momentum is flat. For the long-term uptrend to hold, the price needs to stay above the 200-day SMA—and that’s being tested.
Closing Bell
Here’s the takeaway: Some fundamental developments aren’t always easy to spot. Most investors wouldn’t have caught certain hedge funds’ short-selling moves in MSTR stock. That’s where technical indicators save the day. In this case, it was all about divergence. You can also rely on other indicators to catch trends before they’re obvious. Use the StockCharts tools listed in the Member Tools section of Your Dashboard to stay ahead with timely, actionable insights.
Last but not least, be sure to save MSTR in one of your StockCharts ChartLists.
Disclaimer: This blog is for educational purposes only and should not be construed as financial advice. The ideas and strategies should never be used without first assessing your own personal and financial situation, or without consulting a financial professional.