


The House of Mouse has taken a serious nosedive over the last three years, having gone from a high of about $201 down to $89 and change—a 55% drop that feels like one of its roller coaster rides. Not exactly the thrill Disney shareholders were hoping for.
But Disney (DIS) has an ace in the hole, so to speak, that just might be its saving grace: a formidable economic moat (you know…brand strength, intellectual property, diversified segments, economies of scale, etc.).
Is Disney a Near-Term Bust And Long-Term Bargain?
Right now, Disney’s facing some big challenges, and the market isn’t a fan of short-term uncertainty. But looking ahead, there’s plenty of room for a comeback if the company gets its house back in order. Assuming that it eventually does, anyone willing to buy Disney at these levels would be looking for a technical trigger for a longer-term trade. Where might that be?
Disney’s Macro Price Action
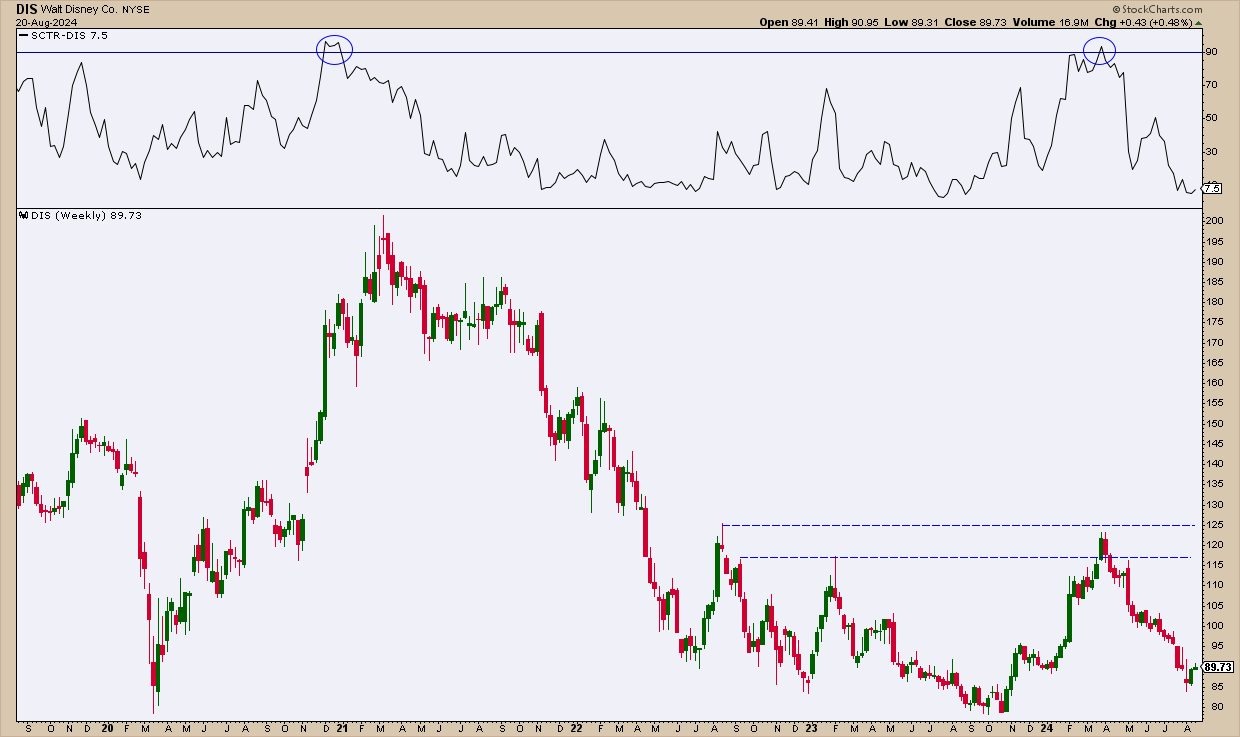
CHART 1: WEEKLY CHART OF DISNEY. It’s virtually back to its 2020 COVID Crash low.
Looking at a weekly chart, Disney’s StockCharts Technical Rank (SCTR) score hit a super-bullish 90 twice, but, for the last three years, it’s been scraping the bottom of the chart. Currently, Disney’s stock price is not too far above its pandemic lows.
Here’s another interesting thing: Look at the resistance levels (blue dotted lines) at $115 and $125. Not only do these mark swing high points that repulsed price twice, but the range itself also happens to be the “fair value” range estimated by several fundamentally-based analysts. If Disney’s going to bounce back, it needs to break through those resistance levels before any real uptrend can take hold.
Let’s suppose it does. If you’re looking for an early entry point, where might that be? Let’s zoom in on the daily chart.
CHART 2: DAILY CHART OF DISNEY. Watch these levels if you’re looking for an early entry point.
If you’re looking for an early entry point…
Wait for a break above the trendline (see blue dotted line and circle) and make sure the volume supports the breakout (plus any follow-through in volume would be welcome).You’ll also want to see strong momentum. The chart above uses the Chaikin Money Flow (CMF), one of many momentum indicators you can use. Right now, the CMF is at the zero line; you’ll want to see a surge in buying pressure.Currently, the Relative Strength Index (RSI) is at a midpoint and rising from a bullish divergence (see blue dotted line on the RSI indicator), indicating room for potential upside.Lastly, take a look at the magenta rectangle. It marks the potential resistance range from the weekly chart, and also lines up with analysts’ “fair value” projections. Translation: Disney might be undervalued right now.At the Close
So, is Disney a bust or a bargain? The House of Mouse has seen better days, but it’s not out of magic just yet. With stocks near pandemic lows and key resistance levels to watch, there’s a possible upside for those willing to hang tight. A break above the trendline, fueled by strong buying momentum, just might signal the start of Disney’s next chapter. As for now, it’s a waiting game.
Disclaimer: This blog is for educational purposes only and should not be construed as financial advice. The ideas and strategies should never be used without first assessing your personal and financial situation, or without consulting a financial professional.