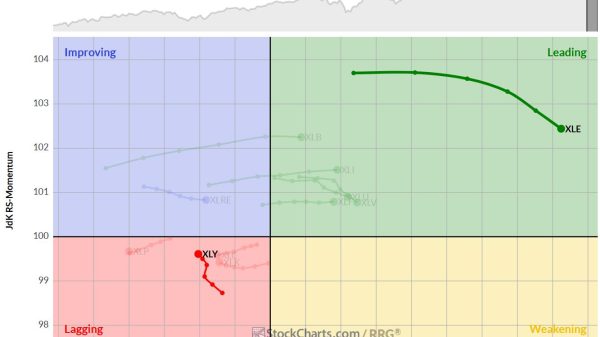
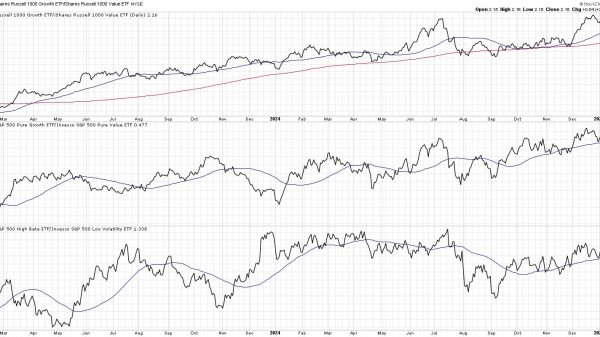
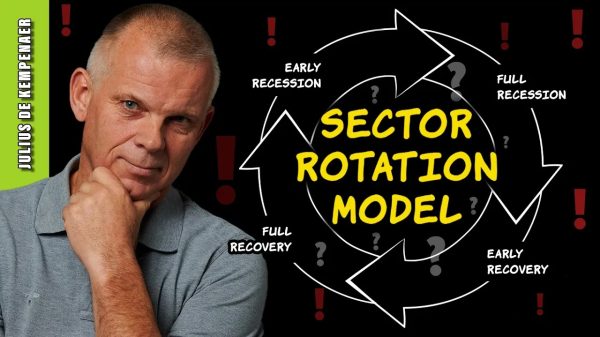
In this exclusive StockCharts TV video, Joe shows the four stages a stock or market can be in at any time. He explains each stage and how ADX & Volatility can help define each stage. He then shows what stage the SPY is right and why the bias is still positive. From there, Joe shares a pullback screen in StockCharts and then goes through the 11 sector SPDRs to show the shifts that are taking place. Finally, he goes through the symbol requests that came through, including META, SBUX, and more.
This video was originally published on August 14, 2024. Click this link to watch on StockCharts TV.
Archived videos from Joe are available at this link. Send symbol requests to stocktalk@stockcharts.com; you can also submit a request in the comments section below the video on YouTube. Symbol Requests can be sent in throughout the week prior to the next show.


