


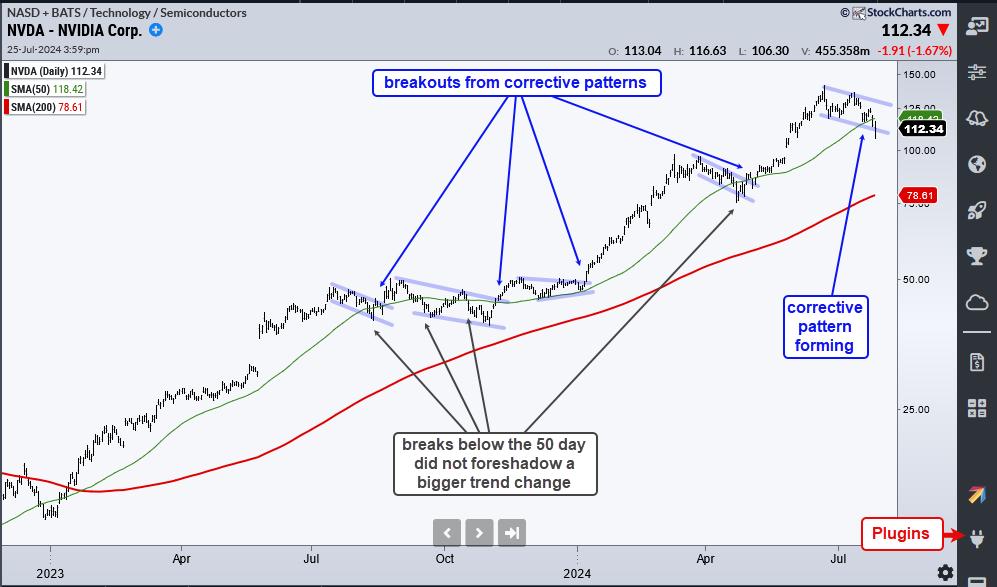
After a big run this year, Nvidia (NVDA) fell over 15% from its high and broke its 50-day simple moving average (SMA). On the face of it, a break below this “key” moving average seems like a short-term bearish signal. Such a view, however, would ignore the long-term trend, which is the dominant force at work.
The first job is to define the long-term trend because this provides perspective and sets the trading bias. Nvidia is clearly in a long-term uptrend because it is well above the rising 200-day SMA, and recorded a new high a month ago. During a long-term uptrend, declines are viewed as corrections that provide opportunities. Therefore, the break below the 50-day SMA is more of an opportunity than a threat. Our reports and videos this week suggest the same for QQQ.
Corrections come in all shapes and sizes. We could get a short pullback, an extended pullback, or a trading range. Nobody really knows. The decline into April broke the 50-day SMA, but this correction was short-lived as the stock broke out in early May. The decline in September-October 2023 was longer because NVDA broke the 50-day SMA twice. These breaks did not lead to a bigger trend reversal.
Looking at the current break, the decline over the last four weeks looks like a normal correction after a big advance. NVDA was up 78% from mid-April to mid-June. A correction that retraces a portion of this advance is perfectly normal. The long-term trend is still up, and I view this correction as an opportunity, not a threat.
ChartTrader will cover the declines in leading tech and AI stocks on Tuesday, July 30th. We will put these declines into perspective, identify potential reversal zones and mark corrective patterns when possible. This report and video will include Nvidia (NVDA), Broadcom (AVGO), Dell Technologies (DELL), Pure Storage (PSTG) and more. Click here to learn more.
//////////////////////////////////////////////////