Berkshire Hathaway needs no introduction. The name is synonymous with two iconic investors—Warren Buffett (the Oracle of Omaha) and the late Charlie Munger.
Currently, Berkshire’s Class B shares (BRK/B) appear to be hovering at a tense standstill, poised for a major breakout either upward or downward. The shares are midpoint at a narrowing symmetrical triangle pattern. Which way is it likely to break? And is it still a worthy investment?
Why Buy Berkshire Hathaway Shares?
Here are four reasons:
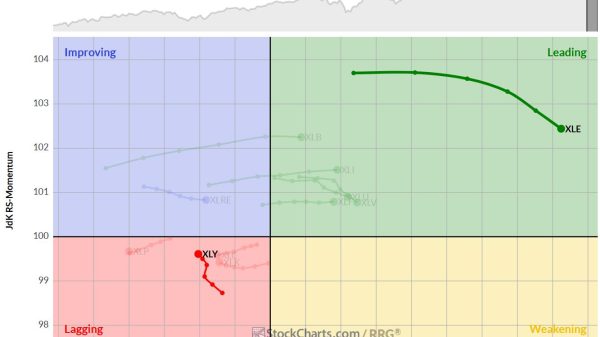
1— Berkshire Hathaway tends to beat the S&P 500 over 90% of the time. In the image below, StockCharts’ PerfCharts illustrates BRK/B’s relative performance against the broader market.
CHART 1. PERFCHART COMPARING BRK/B TO THE S&P 500. The definition of outperformance?
2— BRK/B provides instant diversification in sectors (though not weightings). Still, the company’s holdings in insurance, utilities, energy, transportation, and consumer goods are well-thought and managed (it’s Warren Buffett, after all).
3— The company is loaded with cash. This is a big deal: if the market crashes, Berkshire Hathaway has plenty of ammo to take advantage of buying value stocks at a low price while everyone on Wall Street is panicking.
4— Share prices are still reasonably valued. Its P/B ratio is 1.55; you can view this using StockCharts’ Symbol Summary.
Looking Back 20 Years
BRK/B may not have the most impressive SCTR score (68.5), but again, looking back over 20 years, it has averaged around the 60 range. Still, its uptrend has been nothing less than impressive.
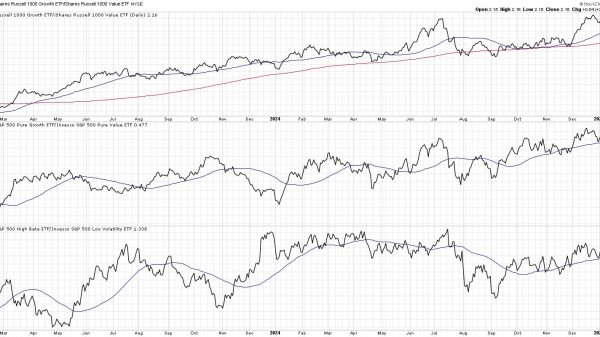
Looking at a weekly chart, its relative performance against the S&P 500 ($SPX) shows a consistent beat, save for the years leading up to the 2008 financial crisis and the 2000 Dot.com bubble (not shown on the chart).
CHART 2. 20-YEAR WEEKLY CHART OF BRK/B. Note that not all mediocre SCTR readings indicate mediocre performance.
Is BRK/B Poised for an Explosive Move?
Take a look at BRK/B’s daily chart (see below).
CHART 3. DAILY CHART OF BRK/B. It appears as if BRK/B shares are poised for an explosive move. Still, triangle formations can go either way; the trick to getting the odds in your favor is to look at the buying or selling pressure leading to the anticipated breakout.
Currently, BRK/B is working its way through a symmetrical triangle formation, which, according to Edwards and Magee in Technical Analysis of Stock Trends (1948), suggests that roughly 75% of symmetrical triangles are continuation patterns and the rest mark reversals. Still, the direction of price movement in triangle patterns is uncertain until a breakout occurs. The breakout will provide confirmation of the potential price direction.
But if you look at the momentum leading up to the anticipated breakout, the signs are bullish, as both the Chaikin Money Flow and Accumulation/Distribution Line indicate that buying pressure is on the rise.
Whether you go long following an upside breakout or before it takes place, a few points below the bottom of the triangle formation at $395 serves as a good stop loss level, as it also marks the most recent swing low. If price falls below that level, the next “technical” support level will likely be in the $370 range.
The Takeaway
Berkshire Hathaway Class B shares (BRK/B) have a lot going for them, making them a solid buy for many investors. The stock often outpaces the S&P 500, provides robust diversification, the company has ample cash reserves, and its current valuation is attractive. While the stock’s near-term movement is uncertain as it navigates a symmetrical triangle pattern, momentum suggests a positive breakout could be on the horizon. But it all boils down to this: would you bet in favor of or against the Oracle of Omaha?
Disclaimer: This blog is for educational purposes only and should not be construed as financial advice. The ideas and strategies should never be used without first assessing your own personal and financial situation, or without consulting a financial professional.


