


No Confirmation In Volume.
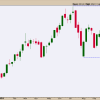
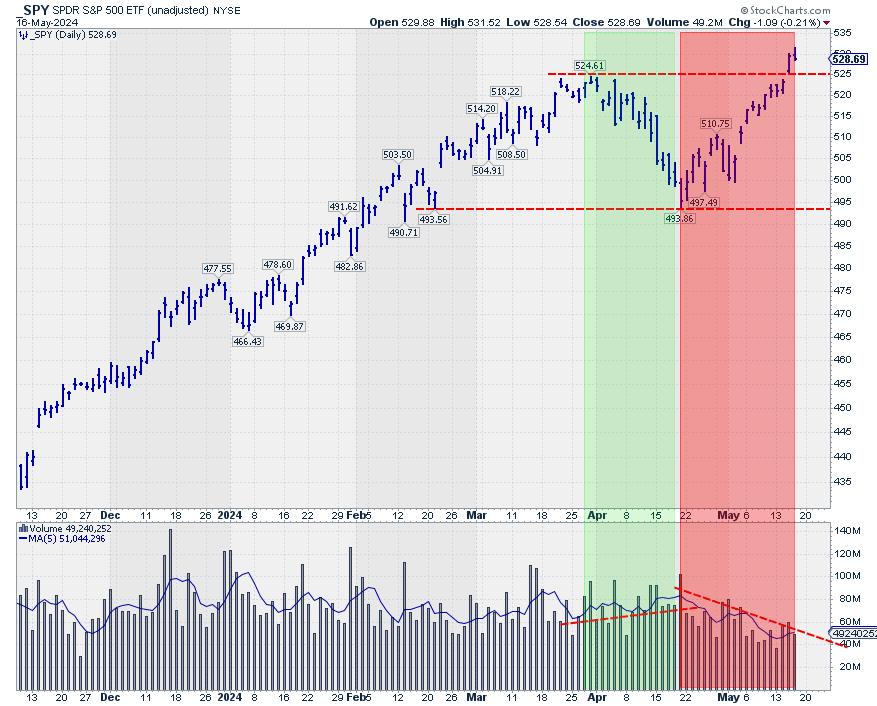
This week, the S&P 500 is breaking out above its previous high, undeniably a bullish sign for the market.
After the initial break on Wednesday, the market held up well on Thursday. However, a few things are holding me back from getting overly enthusiastic.
One of the issues is the volume pattern, as can be seen on the above spy chart. The lower pane holds the volume combined with its moving average (the blue line). During the decline from the 525 peak at the end of March all the way down to 494 in the second half of April, the volume rose slightly. So, we had a declining price on rising volume.
The rally out of the low has taken place on declining volumes. The technical rule is that volume should increase in the direction of the trend. So, if we were in a full-fledged uptrend, I would have expected the volume to decline during the move lower and then rise again from 494 to current levels. Also, higher volumes do not accompany the break above resistance, which usually makes upward breaks (more) reliable.
Sector Rotation Not Supportive
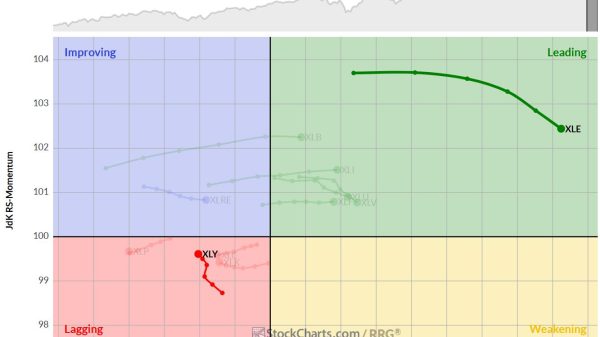
The relative rotation graph above shows long and strong tails for defensive sectors. As you know, the traditionally defensive sectors are utilities, consumer staples, and healthcare.
Utilities and staples are inside the improving quadrant and on a strong RRG-Heading toward leading. The healthcare sector is inside the lagging quadrant and has just started to curl back up.
Reading from the JdK RS-Ratio axis, energy is the strongest sector at the moment. Although it is not considered a really defensive sector, it has a low beta compared to other sectors, which is also a defensive characteristic.
On the other hand, we see a really offensive sector like consumer discretionary inside the legging quadrant and moving further into it. Other sectors inside the lagging quadrant are technology and real estate. Both move lower on the JdK RS-ratio scale at a stable negative RS-momentum level.
Other more offensive or cyclical sectors, like materials, industrials, and financials, are inside the leading quadrant. Still, they have rolled over and are now out of the zero to 90-degree RG heading. Overall, this combination of rotations is not what you would expect during a strong rally in a bull market.
A strong rally in the S&P 500 is not in line with this type of sector rotation.Obviously, there are two ways this situation can be resolved. The first one is that the sector rotation will move to a more offensive trajectory in the coming weeks, matching and catching up with the rally in the S&P 500. The second one is that the S&P 500 gets back in line with a more defensive rotation.
Asset Class Rotation Turning Towards Bonds
Finally, the third observation that makes me cautious is the current state of asset class rotation. as seen in the RRG above.
The tail for SPY is inside the leading quadrant but has been moving lower on the RS momentum scale for a few weeks already, almost crossing over into the weakening quadrant. The tails for fixed-income-related asset classes, government bonds, corporate bonds, and high-yield bonds are inside the improving quadrant, and all are moving at a positive RRG-heading.
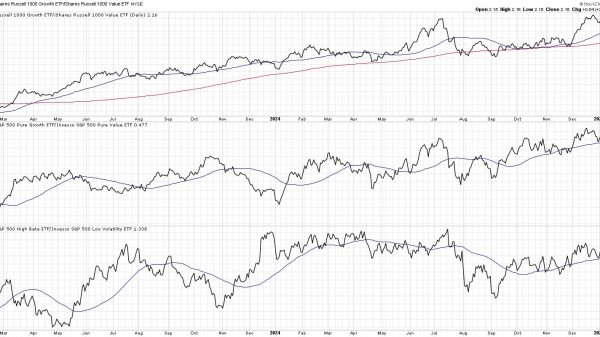
Bringing that relationship back to the SPY:IEF chart shows us that this ratio is struggling with the resistance offered by the previous peak, around 5.7.
At the same time, the RSI plotted below the price chart shows a buildup of negative divergence. As you know, this is usually a sign of, at least, a pause or a turn in the existing trend.
A clear reversal of this trend would mean that bonds are taking over the leadership role from stocks. And this usually happens when stocks are moving lower.
All In All
All in All, these three observations make me very cautious regarding the quality of the upside break in the S&P500.#StayAlert. Have a great weekend, –Julius