


There is a certain ebb and flow in uptrends. Often we see some sort of stair step higher with big advances and smaller corrections along the way. In Dow Theory terms, the primary trend is up and declines within a primary uptrends are considered secondary price moves. Also called corrections. Corrections and subsequent reversals offer traders a chance to partake in the uptrends. Today’s report will focus on the Bitcoin ETF (IBIT). ChartTrader at TrendInvestorPro specializes in such setups and IBIT was featured in Thursday’s report and video.
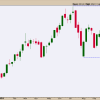
The chart below shows IBIT doubling with a move from 22 to 44 (January 23rd to March 12th). Bitcoin, the underlying asset, hit a new high in March so I will assume this is a new high for IBIT, even though it started trading in January. Despite its short history, we can see the classic ebb and flow of an uptrend on the price chart. The 100% advance is part of the primary uptrend and the decline back the low 30s is a secondary move, or correction.
Also notice that this correction retraced 50-61.8 percent of the prior advance and formed a falling wedge. This retracement amount is normal for a correction. Think two steps forward and one step backward. The falling wedge is also typical for corrections and provides us with clear resistance levels to watch for breakouts. IBIT broke the upper trendline and exceeded the early May high with a surge this week. This breakout signals a continuation of the bigger uptrend and targets a move to new highs. The green shading marks re-evaluation support at 34.
I featured this IBIT chart in the ChartTrader report and video this past Thursday. We are also seeing a similar setup in a related ETF and this was posted on Friday (17-May). ChartTrader reports and videos focus on tradable setups within bigger uptrends. Recently we highlighted Vertex (VRTX), Oracle (ORCL), Crowdstrike (CWRD), the Cybersecurity ETF (CIBR) and the Home Construction ETF (ITB). Click here to learn more.
——————————————–