


Once a darling of the tech industry, Salesforce (CRM) had fallen out of favor until recently, when it hit a new all-time high earlier this year. Since then, though, investors have continued to shy away from this cloud computing stock as they focus on more pure AI-related companies, and Salesforce is at risk of turning lower again. As CRM matures and growth rates moderate, it simply cannot continue to command the industry-leading valuations it once did, and has to face the reality of its fundamentals.
Analyzing Salesforce
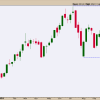
If you look at a five-year chart of CRM, you will see that the stock has traded within a significantly wide range of $130 to $310. Earlier this year, it revisited the upper bound of the range and attempted to break out higher to a new all-time high (see chart below). This quickly failed, and the stock reversed back into the range, with momentum recently turning negative. This suggests that CRM will likely continue to trade back towards the midpoint of the range, i.e., in the $210–220 area.
CHART 1. DAILY CHART OF SALESFORCE (CRM) STOCK. CRM’s stock price tested a resistance level and turned lower. Momentum is also negative, which means the stock is likely to move lower.Chart source: StockCharts.com. For educational purposes.
CRM currently trades at over 28x forward earnings, which flies in the face of growth rates that have moderated significantly over the past 12 months. After averaging EPS growth of over 45% over the past three years, future EPS growth is expected to slow to just a third of that at 16%. Revenue growth is expected to drop to under 10%. This makes a valuation that is 40% higher than the S&P 500 harder to justify when growth rates are slowing down significantly.
A Bear Put Vertical Spread For Salesforce
When you have a bearish outlook on a stock, a bear put spread can be a viable options strategy to implement. The strategy involves buying a put option with a strike price at the current stock, and then selling a put option with a lower strike price with the same expiration. Your maximum risk is the net premium paid between the two legs. The risk graph below illustrates the profit and loss scenario of a bear put vertical spread.
RISK GRAPH OF A BEAR PUT SPREADIf the stock declines below the lower strike price, the strategy will realize the maximum profit potential of the distance between the two strikes minus the premium paid. Also, if the stock were to stay above the higher strike price, you would realize the maximum loss potential.
With earnings in three weeks, CRM options prices are slightly elevated and warrant using a spread to lower the cost of seeking bearish exposure. I’m going out to the July expiration and buying the $280/$250 put vertical @ $10.70 debit. This entails:
Buying July $280 puts @ $15.43Selling July $250 puts @ $4.73This would risk $1070 per contract if CRM is above $280 at expiration, while potentially making $1930 per contract if CRM is below $250 at expiration.
The Takeaway
If you want to profit from a potential decline in a stock’s price, you could trade a bear put spread. It limits your risk, has reasonable profit potential, and is cost-effective.