


In the previous technical note, we had expressed concerns over the Nifty and VIX rising in the same direction simultaneously. As mentioned earlier, in such circumstances, the VIX often ends up acting as a lead indicator and a precursor to an impending corrective move. The previous week had seen VIX spiking up by 33.80%. This week as well, over the past five sessions, the VIX has surged another 26.37% to 18.47. However, the markets, much on the anticipated lines, wore a corrective look and ended the week on a negative note. The trading range also stayed wider as the Nifty oscillated in a 656-point range; it ended with a net weekly loss of 420.65 points (-1.87%).
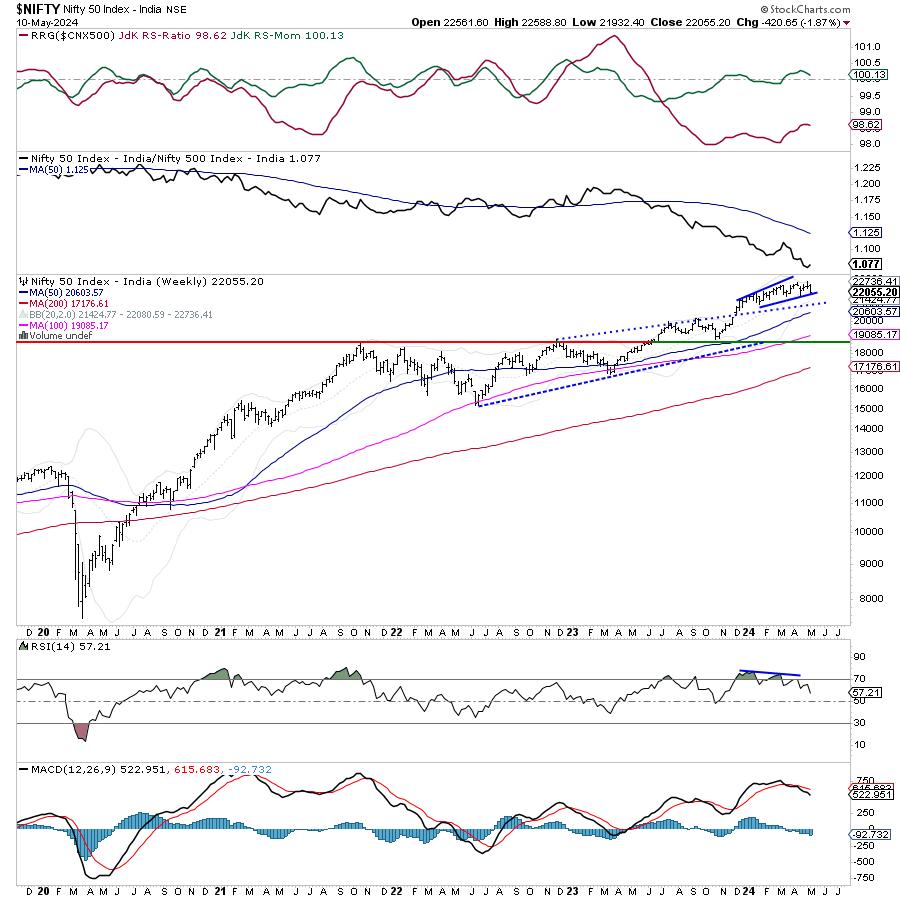
India Vix has spiked over 76% from the most recent lows in the last two weeks. The markets too have traded on the anticipated lines. At present, the Nifty has closed at the 20-week MA which is currently placed at 22080. On the daily charts, the Index has managed to defend the 100-DMA which is presently at 21992. This makes the 22000-22100 zone the most immediate support zone for the Nifty. Over the coming week, we may see mild technical pullbacks; however, defending the 22000 level would be crucially important as any violation of this support zone would increase the possibility of the Index testing the 50-week MA placed at 20603.The markets may see a relatively stable start to the week with levels of 22250 and 22400 acting as potential resistance points. The supports come in at 22000 and 21780 levels.
The weekly RSI is at 57.21; it has formed a new 14-period low which is bearish. It also shows a bearish divergence against the price. The weekly MACD is bearish and trades below the signal line. The widening Histogram indicates increased momentum on the downside.
The previous week had seen the formation of a Doji on the candles. This is followed by a large bearish engulfing candle, the body of which engulfs the prior candle’s body. This, in a way, confirms the level of 22775 as an immediate top for the markets unless taken out convincingly.
The pattern analysis shows that the Nifty had created a small rising channel; it has tested the lower edge of that channel which also coincides with the 20-week MA. This level, along with the 100-DMA on the daily charts makes the 22000-22100 zone the immediate support zone for the Index. A violation of this zone will invite incremental weakness for the markets.
Overall, the markets will continue to portray a tentative mood. It may show technical rebounds from current levels; however, these rebounds, if at all they occur, are likely to stay capped to their extent. The markets continue to stay vulnerable to profit-taking bouts at higher levels. It is strongly recommended that one must stay highly selective while making fresh purchases; it is also expected that the markets may turn a bit defensive as well. While keeping leveraged exposures at modest levels and vigilantly protecting profits, a highly cautious approach is advised for the coming week.
Sector Analysis for the coming week
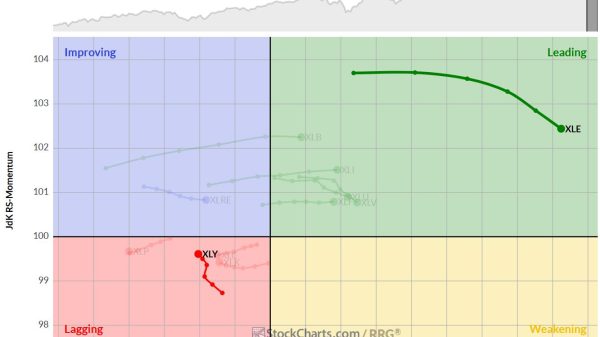
In our look at Relative Rotation Graphs®, we compared various sectors against CNX500 (NIFTY 500 Index), which represents over 95% of the free float market cap of all the stocks listed.
Relative Rotation Graphs (RRG) show that only Nifty Auto, Metal, and Consumption Indices are inside the leading quadrant. They expected to relatively outperform the broader markets.
While the Midcap 100 Index is inside the weakening quadrant, it is seen improving its relative momentum. This may lead to the broader markets bettering their relative strength as well. Besides this, Commodities, Pharma, Energy, Infrastructure, PSU Bank, PSE, and Realty Index are placed inside the weakening quadrant. Isolated stock-specific performance may be seen in these pockets but overall relative performance of these sectors may continue slowing down.
The NIFTY IT and the Media Indices are inside the weakening quadrant. The Media space is seen sharply improving its relative momentum against the broader markets.
The FMCG Index has rolled inside the improving quadrant. This may mean the beginning of a phase of this sector index’s relative performance against the broader markets. Besides this, Nifty Bank, Financial Services, and the Service Sector Index are also inside the improving quadrant.
Important Note: RRG™ charts show the relative strength and momentum of a group of stocks. In the above Chart, they show relative performance against NIFTY500 Index (Broader Markets) and should not be used directly as buy or sell signals.
Milan Vaishnav, CMT, MSTA
Consulting Technical Analyst
www.EquityResearch.asia | www.ChartWizard.ae