


Stocks fell sharply into late April and then rebounded over the last two weeks. SPY fell 5.34% from March 28th to April 19th and then rebounded with a 3.26% gain the last two weeks. Does this bounce have legs? Chartists can separate serious bounces from dead-cat bounces using breadth. Today’s example will use the S&P 500 and the percentage of S&P 500 stocks their 20 day SMAs.
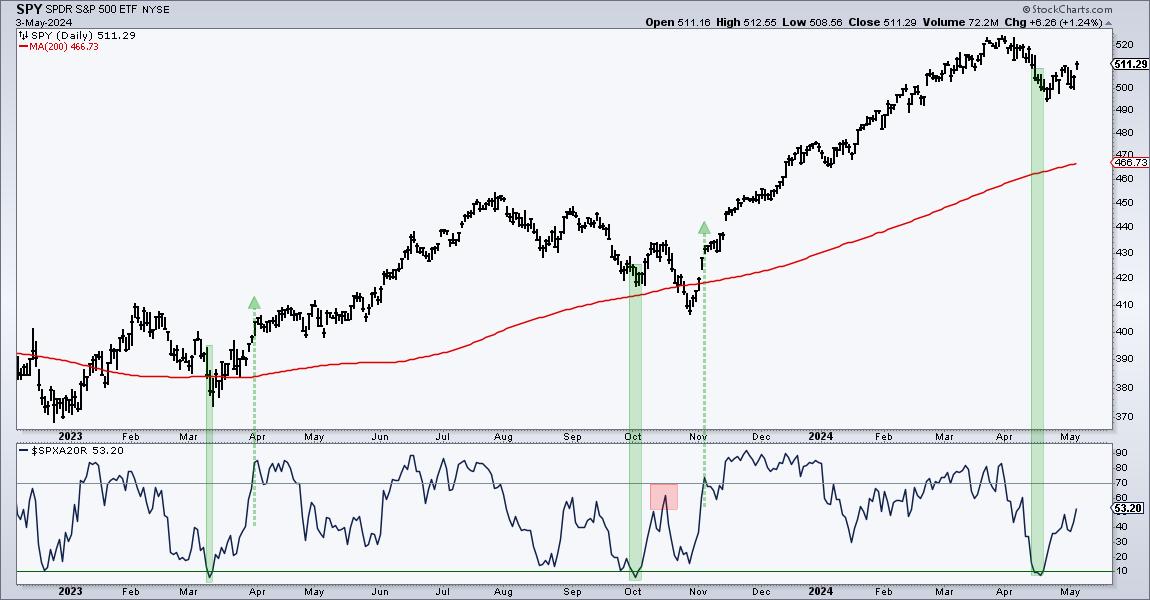
There are two steps. First, the indicator needs to become oversold (setup). Second, we need to see a significant increase (breakout) in upside participation (signal). An oversold reading signals a significant decline and provides the setup for a bounce. Aggressive traders can trade the oversold condition. A subsequent move above the breakout level signals adequate participation to sustain the advance. Now comes the subjective part. We must choose our oversold and breakout levels. I am choosing 10 and 70 percent for SPX %Above 20-day SMA.
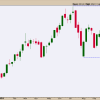
The green shading on the chart above shows when SPX %Above 20-day became oversold and the green arrow-lines mark the subsequent move above 70%. There were setup-signals in March-April and again in October-November. Both led to significant bounces. Notice the red shading where the indicator failed to clear 70% in mid October. This was a feeble bounce and SPY moved to a new low in late October. SPX %Above 20-day then surged above 70% in early November for a signal. Recently, the indicator became oversold here in mid April for a setup and moved back above 50% this week. An oversold bounce is indeed underway, but I need to see a move above 70% to show a participation breakout.
We are monitoring the rebound in the S&P 500 and Nasdaq 100 at TrendInvestorPro (ChartTrader). Our 10 indicator composite indicator became oversold in mid April, but we have yet to see the required breadth thrust to signal a strong increase in participation. ChartTrader reports and videos provide broad market timing signals and trading setups for leading stocks and ETFs. This week we featured setups in the T-Bond ETF (TLT), the Biotech SPDR (XBI) and four Tech ETFs (IGV, SOXX, CIBR, SKYY). Click here for immediate access.
//////////////////////////////////////////////////