


What’s a trader to do when the stock market looks indecisive? Sit back and wait for the market to show direction.
This week is packed with earnings from big tech companies, jobs reports, and investors anxious to hear what Jerome Powell says about possible interest rate cuts this year. So, while you’re patiently waiting for the stock market to show direction, it doesn’t hurt to do some chart analysis.
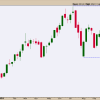
Get the live chart here.Take a look at the SPDR S&P 500 ETF (SPY) daily chart below. You can see that SPY bounced off the April 19 low, hit resistance at the 50-day simple moving average (SMA), and dipped lower.
CHART 1. DAILY CHART OF SPY. The pullback in SPY could bring it close to $470 unless it breaks above the 50-day moving average.Chart source: StockCharts.com. For educational purposes.
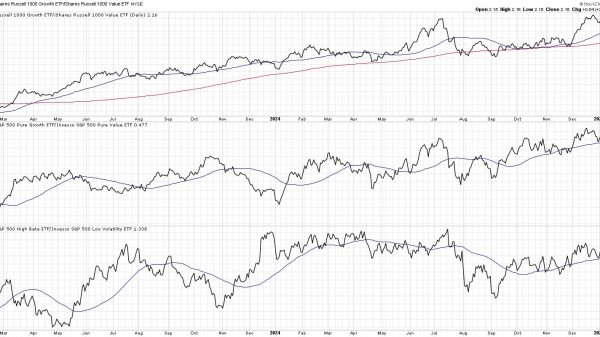
Looking at the breadth indicators in the lower panel, the percentage of stocks trading above their 50-day moving average hit the 50 level but turned lower, and the S&P 500 Bullish Percent Index is just above 50. Overall, it looks like market breadth is, at best, meh.
Will strong earnings from tech companies help push the stock market higher? It probably won’t be enough. Amazon (AMZN) beat earnings, and its stock was trading higher in after-market hours. AMD also beat earnings, but the stock was trading lower in after-market hours. The focus will be on Powell when he takes the podium on Wednesday.
Three Levels To Watch
Although price action is never the same as past action, it’s worth analyzing it during the 2023 pullback in SPY. Applying the Percentage Change tool from the July 2023 high to the October low, the correction was about 10.70%, with five up-and-down waves of lower highs and lower lows. The pullback had a three-month lifespan. Could a similar scenario play out this time? No two instances are identical, but watching the price action unfold can be interesting.
How to annotate your charts with the Percentage Change tool.
Click the Annotate button > Text icon > Percentage ChangeDrag from a top to a bottom to see the percentage change.Explore the different annotations available on StockCharts.com.
Three key areas to watch are as follows:
April 19, 2024 low. If SPY goes below this level, we could see a series of lower highs and lower lows.April 29, 2024 high. A close above this level would invalidate downtrend conditions and reverse the correction.The $470 level. This would mark a 10.6% correction. It’s also close to the 50% Fibonacci retracement level.Looking at the breadth indicators in the lower panels, both started declining following the August high. Both crossed above the 50 threshold level at around the same time, coinciding with the stock market’s bull rally.
The Takeaway
This is a big week in the stock market, and it’s best to follow a chart similar to the one discussed here. Download the live chart and save it to your ChartList. You can also try applying a similar analysis to indexes and other index ETFs, such as QQQ and DIA.
If you’re looking to buy on the dip, wait for the broader market to show signs of reversing before buying individual stocks. Always follow the price action, as it boosts your market engagement skills, making you a smarter trader.
Disclaimer: This blog is for educational purposes only and should not be construed as financial advice. The ideas and strategies should never be used without first assessing your own personal and financial situation, or without consulting a financial professional.